
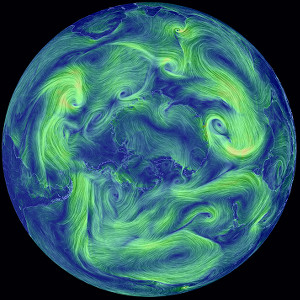
earth
世界中の気象状況がビジュアライズ
スーパーコンピュータが予報
3時間ごとの更新
海流
5日ごとの更新
海面水温と
一日平均(1981-2011)の海面水温異常
毎日更新
波浪
3時間ごとの更新
aurora
updated every thirty minutes
 サイトのサポートのためのアートワークをPoint.Bスタジオから購入
licensing
contact inquiries@nullschool.net for licensing or other questions
translations
help translate this site by visiting translate.nullschool.net
| コミュニティ | Facebookページ |
| 作り手 | Cameron Beccario @cambecc |
| ソースコード | github.com/cambecc/earth |
| 使用ライブラリ |
D3.js node.js |
| 天気予報データ |
GFS (Global Forecast System) EMC / NCEP / NWS / NOAA |
| 海流データ |
OSCAR Earth & Space Research |
| 海面水温 |
OSTIA (Operational Sea Surface Temperature and Sea Ice Analysis) UK Met Office + GHRSST + CMEMS (E.U. Copernicus Marine Service Information) RTGSST (Real Time Global Sea Surface Temperature) MMAB / EMC / NCEP / NWS / NOAA |
| 波浪 |
WAVEWATCH III MMAB / EMC / NCEP / NWS / NOAA |
| エアロゾルと大気化学 |
GEOS-5 (Goddard Earth Observing System) GMAO / NASA CAMS (Copernicus Atmosphere Monitoring System) Copernicus / European Commission + ECMWF |
| オーロラ |
OVATION SWPC / NCEP / NWS / NOAA Processing script written by Stephanie Hamilton (profile) |
| GRIB/NetCDF デコーダ | UCAR/Unidata THREDDS |
| 地理データ | Natural Earth |
| ホスティング |
CloudFlare Amazon S3 |
| フォント |
M+ FONTS Google Noto Fonts |
| Icons | Font Awesome Free by @fontawesome - CC BY 4.0 |
| Translation Management | OneSky |
| カラースケール |
ColorBrewer2.org Kindlmann Linear Luminance MYCARTA Dave Green's cubehelix |
| ウォーターマン蝶型 | watermanpolyhedron.com |
| 関連サイト | air.nullschool.net |
| インスピレーション | HINT.FM wind map |
各気圧によるおおむねの高度
note: 1 ヘクトパスカル (hPa) = 1 ミリバール (mb)
| 1000 hPa | 00,~100 m, 周辺海水位 |
| 850 hPa | 0~1,500 m, 大気境界層〖下〗 |
| 700 hPa | 0~3,500 m, 大気境界層〖上〗 |
| 500 hPa | 0~5,000 m, 渦度 |
| 250 hPa | ~10,500 m, ジェット気流 |
| 70 hPa | ~17,500 m, 成層圏 |
| 10 hPa | ~26,500 m, もっと成層圏 |
the "Surface" layer represents conditions at ground or water level
this layer follows the contours of mountains, valleys, etc.
overlays show another dimension of data using color
some overlays are valid at a specific height
while others are valid for the entire thickness of the atmosphere
| 風速 | wind speed at specified height |
| 気温 | temperature at specified height |
| 相対湿度 | relative humidity at specified height |
| WPD |
風力エネルギー密度 measure of power available in the wind: ½ρv3, where ρ is air density and v is wind velocity |
| 可降水量 |
可降水量 total amount of water in a column of air stretching from ground to space |
| 雲水量 |
雲水量 total amount of water in clouds in a column of air from ground to space |
| 3HPA |
3時間の降水量 現在から3時間後までの降水量 |
| CAPE |
対流有効位置エネルギー(地上) indicates the buoyancy of air, a measure of atmospheric instability and predictor of severe weather |
| 海面更正 |
海面更正気圧 air pressure reduced to sea level |
| 体感温度 |
体感温度 perceived air temperature as combination of heat index and wind chill |
| 海面水温 |
海面水温(SST) temperature of the ocean surface |
| 海面水温異常 |
Sea Surface Temperature Anomaly difference in ocean temperature from daily average during years 1981-2011 (OSTIA anomalies are calculated from the daily Pathfinder climatology) |
| 有義波高 |
Significant Wave Height roughly equal to mean wave height as estimated by a "trained observer" |
| COsc |
一酸化炭素地上濃度 the fraction of carbon monoxide present in air at the earth's surface |
| CO2sc |
二酸化炭素地上濃度 the fraction of carbon dioxide present in air at the earth's surface |
| SO2sm |
二酸化硫黄地上質量 amount of sulfur dioxide in the air near the earth's surface |
| DUex |
Dust Extinction the aerosol optical thickness (AOT) of light at 550 nm due to dust |
| SO4ex |
Sulfate Extinction the aerosol optical thickness (AOT) of light at 550 nm due to sulfate |
| PM1 |
粒子径1µm以下(PM1) mass of atmospheric particles with a diameter less than 1 micron |
| PM2.5 |
微小粒子状物質(PM2.5) mass of atmospheric particles with a diameter less than 2.5 microns |
| PM10 |
粒子径10µm以下(PM10) mass of atmospheric particles with a diameter less than 10 microns |
about ocean waves
Significant Wave Height is the average height of the highest 1/3 of waves at a particular point in the ocean. There's a great writeup here describing what this means.
Peak Wave Period is the (inverse) frequency of the most energetic waves passing through a particular point, whether wind generated or swells. Certainly, there are many more groups of waves moving through an area, each in different directions, but trying to show them all rapidly becomes complex. Instead, we show the one wave group contributing the most energy. This has the effect, though, of creating "boundaries" between regions of ocean where the #1 wave group suddenly switches to second place. Often these boundaries represent swell fronts, but other times they are just artifacts of the ranking mechanism.
about CO2 concentrations
for dates earlier than 2017-01-24 04:30 UTC
While implementing the visualization of CO2 surface concentration, I noticed the NASA GEOS-5 model reports a global mean concentration that differs significantly from widely reported numbers. For example, from the run at 2015-11-23 00:00 UTC, the global mean is only 368 ppmv whereas CO2 observatories report concentrations closer to 400 ppmv. GEOS-5 was constructed in the 2000s, so perhaps the model does not account for accumulation of atmospheric CO2 over time? This is simply speculation. I am just not certain.
To bring the GEOS-5 results closer to contemporary numbers, I have added a uniform offset of +32 ppmv, increasing the global mean to 400 ppmv. This is not scientifically valid, but it does allow the visualization to become illustrative of the discussion occurring today around atmospheric CO2. Without question, I would welcome a more rigorous approach or an explanation why the GEOS-5 model produces the data that it does.
From 2017-01-24 04:30 UTC, this adjustment is no longer necessary because GEOS-5 appears to have been upgraded.
disclaimer
GEOS-5 data (covering all Chem and Particulates layers) comes with the following disclaimer: Forecasts using the GEOS system are experimental and are produced for research purposes only. Use of these forecasts for purposes other than research is not recommended.
about aerosols and extinction
An aerosol is air containing particles. Common particles are dust, smoke, soot, and water droplets (clouds). These particles affect sunlight primarily through absorption and scattering, which combine to reduce the amount of light reaching the ground. This loss of light as it passes through the atmosphere is called extinction.
One common measure of extinction is aerosol optical thickness (AOT), which is (the log of) the ratio between the power of incoming light and the power of transmitted light. This helps us understand how "thick" the air is with particulates.
keyboard shortcuts
| e | show the menu |
| escape | close dialog/menu |
| k | go forward one time step |
| shift-k | go forward several time steps |
| j | go backward one time step |
| shift-j | go backward several time steps |
| n | go to now (the most recent data) |
| shift-c | 日付選択カレンダー表示 |
| i | go up one pressure level |
| shift-i | go up to the stratosphere |
| m | go down one pressure level |
| shift-m | go down to the surface |
| g | toggle the grid on/off |
| p | toggle the animation on/off |
| shift-h | enable/disable high definition mode |
translators
1599763839 1992pb 2451158917 afropolakwot agagey Aleksander Alexander Kirilov Alexey Dmitriev Alexey Korsakov AlexOrlovets Anderson Porto Andre Lz Andrea de Franco Andrew Pedrini Andrey Bagmanov Antonpek arquerogonza Artur Wisniewski ashawesoman ashvin.j.sherathiya astrostrong asveruz atom benji.poirier bgij bidulem3 Birg3r Bohuslav Šín Bram Versteeve Bryan carina.bringedal carlofrc Cassiel Bclamson Ching-ping Yu Christian Leroux contact cuxcoll Daniel Bartsch Daniel Isak Marinosson Daniel Pawlowski Daniel Rakoczy danielruiz1636 Darlite davalenciano98 Davide Carlier Denat250 deus.05 Dimitris T. Papadimitriou dlo.daniel Dominic Douglas dsantosgtm e Eason Huang egarpunov elier.pila Eric Kim essaii32 estefilippini fantasy_lcl farrasoctara Felipe Faria florian-lerch franci00 FranklinZhang Frederik T. de Ridder fthmiln georg.loesel gherlainfo giacomo.gerosa Gian Centeno giospud gonzalo.ag88 gporter.seadog graceang graham.rimmington grol2901 Hebel holgersson Hyung Wook Jung Ichiro Wang Ignacio Sanz iii1212 InfoSecOne Jae Soo Park Jiří Batelka Joanna Rinne Joao Correia jocelot Jomari Joseph Barrera Jonathan Yang Jose A. Frias Morales juanpaexpedite kai.s.mueller Karol Sapiński Kiyun Jeon kjetil.hoiby kty5663 ku5an2901 laurapaccini leandro1212 leticia.tahnee lretamal Luboš Motl m_strugale marcello.carreira marco.prosdocimo Mark markeletona Markus Schley Martine Bolzinger Matt Tang Mattia Raffa mavilesilva melfi Melissa Ortiz Massó Meow Wang mgb Michael Purer Michael Michel Rivero mikami_1966.1118 mikele.fit95 Miquel Bayo Moreno mir597 MirageF1AZ Miroslaw Lisiak Mohannad Alahmadi nando nunolava1998 Oğuzhan Arı Olivier OLS-RU P_A_N_D_A_M_A_N Paul Bachem Paweł Kowalczyk pdobrev Personim Intaned Philippe Jabet Plamen Dobrev ProffLex Rafael Nonato Bassora rajeshgodvani RaskiPL reyfran8 Riccardo Monfardini robertrosalex Roger Helman Roller978 rosariainpo Russel Schwartz santiago.giraldoc sapan021 sarogrom Seongmin Park september43 Seregalsv Serega silverhaze030 Simone Dragoni siudzin98 skyneon77 sombrasbaul Somil Thesia Stephen Flynn Steven Sunny Miu Tayseer M Alhibshi Telmo John tenderstart thanhhuyenlth Thomas Middelveld Thorsten Schleicher tigormal tigra200sx Tomasz Waligóra torstenleibrich ulaszewski.bartosz ultordima Vasily Tarasenko vhc1967 Víctor Velarde Vu Thuong wasted webfreelance Wonmin Jeong wtlovergirl xesmedic xorpid xrdeem xsqz yaawwad Yauhen Bahashou youngjune4498 Youngmin Jeon Yukun Chen zackcaussy Zulus Οverlord Александр Попов Вячеслав Епиков 피시 潘柏綸


Selected for inclusion in the Climate Literacy and Energy Awareness Network (CLEAN) collection of educational resources.
The GEOS-5 data used on this site have been provided by the Global Modeling and Assimilation Office (GMAO) at NASA Goddard Space Flight Center through the online data portal in the NASA Center for Climate Simulation
Generated using Copernicus Atmosphere Monitoring Service Information 2017-2020. Neither the European Commission nor ECMWF is responsible for any use that may be made of this information.
weather and ocean data are generated from numerical models
earth.nullschool.netは正確な情報を提供するためのものではありません
Copyright (c) 2020 Cameron Beccario